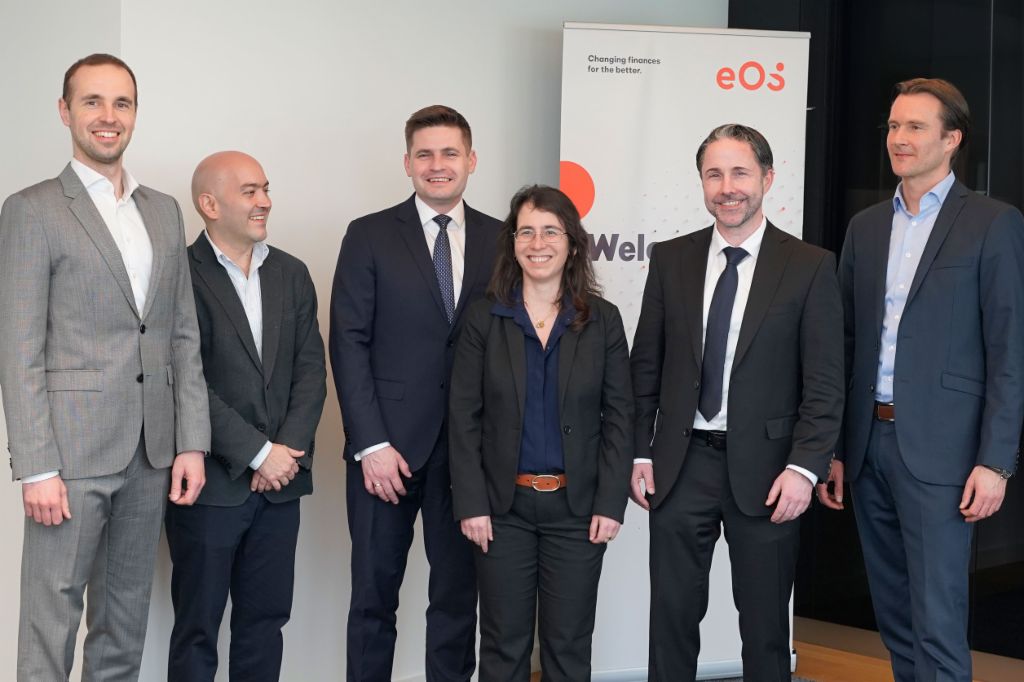
As EOS Group, we benefit from the fact that we are not dependent on individual markets and have established an excellent reputation as investor over the years. Not least because we value long-term investments and base our calculations on realistic forecasts. This gives us and the sellers the security we need to succeed today and in the future.

Our fiscal year
Strong performance in challenging times
The EOS Group looks back on a demanding and successful financial year 2023/24. Despite the challenges in a difficult macroeconomic environment, the EOS Group achieved excellent earnings.
- Thanks to investments in receivables portfolios from previous years, we managed to keep revenue at a high level of EUR 997.3 million
- The EOS Group is in good financial condition. Although EBITDA was lower in fiscal 2023/24 than in the remarkably good previous year, it is still high
- At EUR 583.5 million, investments in Non-Performing Loans (NPLs) were significantly below those in the exceptional year 2022/23
Our financial year in brief
Earnings (EBITDA)
in EUR million
Consolidated revenue
in EUR million
Investment volume
in receivables portfolios in EUR million
Three questions for our new CFO
Eva Griewel, CFO of the EOS Group since August 2024, on leading by example, her expectations for the current fiscal year and the anticipation of re-joining the dynamic EOS family
Insights into fiscal 2023/24
Revenue development and earnings
Stable development: Despite a difficult market environment, EOS Consolidated achieved an excellent result in fiscal 2023/24, validating the previous year’s high revenue level.
Consolidated revenue by region
In fiscal 2023/24 EOS Consolidated achieved high revenue in all regions.
EOS Consolidated maintained or slightly increased the previous year’s high revenue level in all operational regions, largely owing to the strong performance of the EOS companies in the processing of receivables portfolios purchased in past years. With a share of 41.9 percent, Eastern Europe remains the strongest performing region within EOS Consolidated. Significant revenue increases were recorded especially by the companies in Bosnia and Herzegovina, Bulgaria, Greece, and Poland. Together, the Western European EOS companies achieved 32.4 percent of the total revenue in fiscal 2023/24. Here revenue climbed most significantly (+ 6.9 percent) compared to the other regions. One reason for the positive development was successful processing of existing receivables portfolios, especially in France. At 25.5 percent, the share of total revenue in Germany nearly matched the previous year’s level. Solid revenue was achieved in receivables processing, even though the competitive situation remained challenging, and the company purchased fewer receivables portfolios than in 2022/23.
Financial performance in 2023/24
-
Revenue by region
In EUR thousandWith an increase of 2.1 percent to a total of EUR 997.3 million, the revenue of EOS Consolidated in fiscal 2023/24 was slightly above the previous year’s level (EUR 977.1 million). The largest revenue share at EUR 418.3 million was recorded by the companies in Eastern Europe. The region thus exceeded by one percent the previous year’s extraordinarily high revenue level. In Western Europe, revenue climbed 6.9 percent to EUR 323.4 million. At EUR 253.8 million and a share of 25.5 percent of the Group total, revenue in Germany was on a par with the previous year. Revenue earned in North America came from receivables portfolios acquired until 2021 which remained in the EOS Group after the divestment of subsidiaries there. The buyer processes those portfolios in a fiduciary capacity. GRI 201-1
2023/24 2022/23 Change on the previous year (%) Eastern Europe 418,284 414,125 +1.0 Western Europe 323,408 302,508 +6.9 Germany 253,828 252,953 +0.3 North Amerika 1,759 7,525 -76.6 EOS Consolidated 997,280 977,110 +2.1 -
-
Consolidated income statement (summary)
In EUR thousandIn fiscal 2023/24, EOS Consolidated achieved Earnings Before Interest, Taxes, Depreciation and Amortization (EBITDA) in the amount of EUR 412.9 million (previous year: EUR 445.9 million). Compared to the previous year, revenue climbed slightly by 2.1 percent or approximately EUR 20.2 million. The revenue level was maintained due to the extraordinarily high investments made in previous years. GRI 201-1
2023/24 2022/23 Revenue 997,280 977,110 Total operating income 1,008,484 991,251 Earnings Before Interest, Taxes, Depreciation and Amortization (EBITDA) 412,919 445,943 Earnings Before Tax (EBT) 312,921 380,072 Net income 244,349 297,270
-
Assets situation
In EUR thousandTotal assets of EOS Consolidated grew 6.1 percent to a total of EUR 3.2 billion compared with the previous year. Of the total assets, purchased portfolios account for 76.1 percent (previous year: 79.4 percent) and real estate in inventories for 9.0 percent (previous year: 8.7 percent). GRI 201-1
*Financial presentation
2/29/2024 in % 2/28/2023 in % Fixed assets 174,247 5.4 200,620 6.6 Purchased receivables and real estate in inventories* 2,739,113 85.1 2,670,136 88.0 Receivables 70,565 2.2 40,181 1.3 Cash and cash equivalents 174,217 5.4 66,255 2.2 Other assets 61,168 1.9 55,608 1.8 Total assets 3,219,310 100.0 3,032,800 100.0
-
Equity and financing
In EUR thousandIn the past financial year, total financing increased by EUR 186.5 million to EUR 3.2 billion compared with the previous year.
The company’s equity increased by about EUR 0.2 billion to EUR 1.3 billion by means of a partial profit retention. The equity-to-assets ratio increased to 39.9 percent (previous year: 36.6 percent), which, relatively speaking, constitutes a very high level for a financial services provider.
The financial needs of EOS Consolidated are covered by loans from banks and the parent company. Most of this financing with short-term maturity increased slightly from 84 percent to 88 percent of debt financing compared with the previous year. GRI 201-1
For accounting reasons, tables and text may contain rounding differences.
2/29/2024 in % 2/28/2023 in % Equity 1,284.506 39.9 1,110,654 36.6 Provisions 69,485 2.2 58,452 1.9 Liabilities with banks 87,665 2.7 132,387 4.4 Liabilities with related parties and companies 1,411,266 43.8 1,482,754 48.9 Trade payables 142,459 4.4 47,247 1.6 Other liabilities 223,930 7.0 201,306 6.6 Total financing 3,219,310 100.0 3,032,800 100.0
Two decades of successful collaboration
For more than 20 years, the IT service provider Konica Minolta has transferred receivables to EOS in Germany, which allows the company to fully focus on its core business. This video shows us how EOS has helped optimize Konica Minolta’s receivables management.
How the purchase of NPLs strengthens the economy and why EOS is the right partner
When customers can no longer pay back their debts, lending banks too face serious difficulties. After all, too many Non-Performing Loans (NPLs) drive creditors into distress. Creditors solve this problem by selling their receivables to specialized companies, such as the EOS Group. Banks thereby lower their NPL ratio while companies reduce their default risk and transform outstanding receivables into liquidity.
EOS has decades of experience and expertise in debt purchase, that is, in secured (backed by a material countervalue such as real estate) and unsecured debts (such as consumer loans). After purchasing NPLs, EOS strives to find an amicable solution with the borrowers. When successful, liquidity for banks and companies is ensured and capital for new investments is freed up so that the economic cycle can get going again. GRI 2-6
Investments in debt purchases and real estate in 2023/24
In fiscal 2023/24, EOS Consolidated invested a total of EUR 583.5 million in the purchase of unsecured and secured receivables and in real estate. This is a significant decline compared with the previous year’s extraordinarily high investments. EOS purchased most of the NPL portfolios on the Western European market in financial year 2023/24, when it invested EUR 238.6 million. Major transactions were conducted in France, Belgium and Portugal. In Eastern Europe, EOS Consolidated invested EUR 212.5 million in receivables portfolios, for the most part in the Polish, Greek, and Croatian markets. In Germany, the market remained challenging as a result of great competitive pressure. Here EOS Consolidated invested EUR 132.2 million in receivables and real estate.
For accounting reasons, tables and text may contain rounding differences.
Unsecured
Secured / bridge loans / Real estate
Purchased receivables in 2023/24
The carrying value of the portfolios at the end of the financial year was EUR 2.7 billion, which is an increase of about EUR 69.0 million compared with the previous year.
The value of unsecured receivables climbed by EUR 91.4 million compared to the previous year, while the value of secured portfolios and real estate declined slightly by EUR 22.4 million. The companies in Western Europe recorded the highest carrying value Group-wide, followed by Eastern Europe and Germany.
For accounting reasons, tables and text may contain rounding differences.
Unsecured
Secured / Real estate
50 Years of EOS: We share memories
Fifty years of EOS. That’s 50 years of innovation, responsibility, and passion. In our review format we present people who have been part of our successful journey. They tell us what makes EOS special.
Our 2023/24 Report in brief
Our responsibility
Read our Sustainability ReportAn interview with the EOS Board
Read the interviewThree questions for our new CFO
Watch the videoDigital and efficient: our specially developed debt collection software Kollecto+
More about Kollecto+Fair debt collection: How we find solutions for defaulting consumers
More on ethical collection at EOSOverview of the Annual and Sustainability Report
To the overviewOur report for download as a PDF file.
You can download the summary of the Report as a PDF file here.
Reporting period: March 1, 2023, until February 29, 2024
Last revised: August 2024


